

The Belt and Road to Prosperity – Global Shipping Connections – Global Energy Consumption and CO₂ Emissions – China BOOMing again – Net Zero; From Where is the Capital Coming? - [04-02-24]
Direct from BOOM Finance and Economics at the links below

Hat Tip to my colleague at BOOM Fin4ance and Economics Substack (Subscribe for Free) - also on LinkedIn and WordPress. Covid Medical News Network CMN News BOOM Blog and All Editorials (over 5 years) at BOOM Finance and Economics | Designed for Critical Thinkers — UPDATED WEEKLY (WordPress.com)
BOOM Finance and Economics seeks out the very best information from authoritative sources and strives for consistency in its quality and trustworthiness. Over 5 years, BOOM has developed a loyal readership which includes many of the world’s most senior economists, central bankers, their senior advisers, fund managers, and academics. If you want a real edge in understanding the complex world of finance and economics, subscribe to BOOM on Substack or as a Follower on LinkedIn.
BOOM EDITORIAL THIS WEEK

THE BELT AND ROAD TO PROSPERITY WITH 150 NATIONS. China’s Belt and Road Initiative (BRI), is officially known as the “Silk Road Economic Belt and the 21st Century Maritime Silk Road” and is also known as the One Belt One Road (OBOR) strategy. Confused?
It is a transnational economic network proposed and spearheaded by China. The idea of building an inter-continental economic network was first promoted by President Xi Jinping in 2013. The official (glowing) narrative states that the objectives of the OBOR strategy are “to promote economic prosperity of the countries along the belt and road and regional economic cooperation, to strengthen exchanges and mutual learning between different civilisations, and to promote world peace and development.”
High ideals indeed. Nations West of China will especially benefit. Some call this the “Greater China Strategy”. The strategy underlines the Chinese government’s push to export China’s technologies and production capacity in industries such as building materials (steel and cement), electronics, infrastructure (highways and high-speed trains), and logistics (ports and airports).
Energy cooperation between nations is a key aspect while bilateral cooperation and multilateral cooperation are both emphasised.

In his state visit to Kazakhstan in September 2013, President Xi delivered a speech at Nazarbayev University that encouraged worldwide cooperation on the development of the Silk Road Economic Belt. A month later, President Xi addressed the Indonesian Parliament, expressing China’s intention to build the 21st Century Maritime Silk Road with ASEAN countries.
By December 2023, more than 150 countries had joined the Belt and Road Initiative (BRI) by signing a Memorandum of Understanding (MoU) with China. However, due to some uncertainties over some MoUs, it can be more accurately said that 146-151 countries (including China) are now members of the BRI. This is a staggering fact, inconvenient to the politicians of the Western advanced economies who prefer to pretend that all of this is not happening. The countries of the Belt and Road Initiative (BRI) are spread across all continents:
44 countries are in Sub-Saharan Africa
34 countries are in Europe & Central Asia
25 countries are in East Asia & Pacific (including China)
22 countries are in Latin America & Caribbean
19 countries in the Middle East & North Africa
6 countries are in South East Asia
This also includes
17 countries of the European Union (EU), and
8 countries of the G20 Nations.
More official, ambitious narrative, “To build an open, resilient, and mutually beneficial network that connects Asia, Europe, and Africa by land and sea, the new Silk Road initiative intends to establish collaborative partnerships among the sovereign states along the economic corridor and, ultimately, create a transnational community united by shared responsibilities, shared interests, and shared values.”
And more, “The Belt and Road scheme imposes no territorial restraints, and, in compliance with the principles of openness and inclusiveness, welcomes every country and regional organisation. The proposed “five areas of connectivity”, policy coordination, facilities connectivity, unimpeded trade, financial integration, and people-to-people bond are the essential features for establishing a mutually beneficial partnership and reciprocal collaboration between states.”
We can see the central role of China in the BRI and we can see the intentions of the project from these statements made by China. None of this is secret. But that is not enough to build the dream. Energy, transportation connectivity, and finance will be required.
It is quite natural for China to promote its financial model which has successfully built modern China so rapidly over the last three decades.
It is a combination of capitalist endeavour based upon commercial bank credit creation teamed with a disciplined, central oversight, and control of the money supply. This is managed by a strong national central bank. Nations who seek to learn will be guided onto that pathway.
The other, critical part of the Belt and Road Initiative lies in its energy requirements and consumption. An examination of that aspect will reveal what has already happened over the last 10 years and what is likely to happen to CO₂ emissions generated by the BRI nations as their economies grow into the future. Why is this important to understand?
BOOM thinks that poorly led, Western advanced economies are not growing along a road to prosperity but to a future of less reliable money supply and unreliable energy sources. That is a formula for poor economic performance which cannot possibly exceed the Belt and Road strategy over the long term. Source
Much of the data on the Belt and Road Initiative here has been sourced from Fanhai International School of Finance (FISF) at Fudan University, Shanghai, China. And from https://greenfdc.org/countries-of-the-belt-and-road-initiative-bri/

GLOBAL SHIPPING CONNECTIONS. To begin understanding the BRI strategy in depth, it is essential to look at global shipping movements to see what is happening to the maritime transportation of goods. The first thing to note is the dominance of China. The Liner Shipping Connectivity Index (LSCI) aims at capturing a country’s level of integration into global liner shipping networks since the access of a country to international markets will depend largely on its transport connectivity specifically, in the services of exports and imports of the shipping lines.
The LSCI was created by UNCTAD, the United Nations Conference on Trade and Development. In the third quarter of 2023, China was the economy best connected to the global liner shipping network, as measured by the LSCI. The Republic of Korea, Singapore, Malaysia, and the United States of America followed next in the rankings. Three of the top five best-connected ports are in China, namely Shanghai, Ningbo, and Quindao, together with Pusan in the Republic of Korea, and the port of Singapore. This chart compares the top five nations between 2013 and 2023.

The second chart is over a longer time frame 2006-2022 and compares China with Germany, France, Brazil, United States, Japan, Brazil, and Poland. Again China is the leader from 2006; China’s dominance is not a new phenomenon.

CHANGES IN GLOBAL SHIPPING MOVEMENTS. There are various services available where you can watch global shipping movements. BOOM watches one called “Shipping Vessel Finder”. The recent slowdown in the use of the Suez Canal has changed the pattern of movements dramatically. In January, UNCTAD reported that freight through the Suez Canal was down 45% since Houthi attacks began on ships near Yemen. The agency said 39% fewer ships than at the start of December transited the canal, leading to a 45% decline in freight tonnage. Container shipments through the canal were down 82% in mid-January from early December.
UNCTAD’s head of trade logistics said there were now three key global trade routes disrupted, including flows of grain and oils since Russia’s invasion of Ukraine, and the Panama Canal, where low water levels from drought meant shipping last month was down 36% year-on-year and 62% from two years ago.
Dramatic slowdowns in traffic through the Suez Canal and the Panama Canal will cause increased shipping connectivity in all African ports (especially in South Africa) and all South American ports, especially in Brazil, and in nations bordering the Caribbean Sea. That increased connectivity will boost economic growth in these regions.
Please note: Africa’s total population is approximately 1.4 billion people and South America’s is almost half a billion. Also worth noting: Africa’s Working Age Populations are forecast to grow over the next 100 years while the working-age populations of most other regions around the world are forecast to decline.

This image is a snapshot of vessels travelling the globe on 26th March 2024. Note the huge flow of vessels now travelling via South Africa to and from Asia and the Atlantic Ocean. Movements to Africa and South America are growing rapidly. Readers are reminded that South Africa is a prominent member of the BRICS group of nations: Brazil, Russia, India, China, and South Africa.

This close-up view, on 26th March, of the Red Sea entry and exit point near Djibouti and Yemen illustrates that few vessels are now travelling through the Suez Canal.
CHANGING ENERGY CONSUMPTION PATTERNS. These graphs show typical increases in energy consumption, since 1970 in a selection of Belt and Road nations. Note that this is almost all driven by energy from coal, oil, and gas. The Belt and Road Initiative began in 2013.


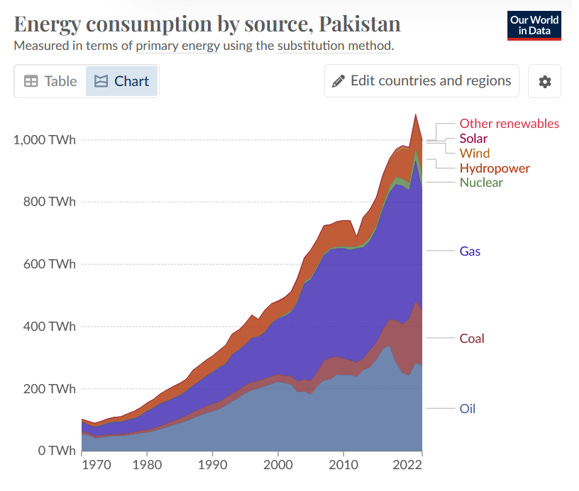

Note: Well over 40,000 Terawatt Hours of annual energy consumed and RISING
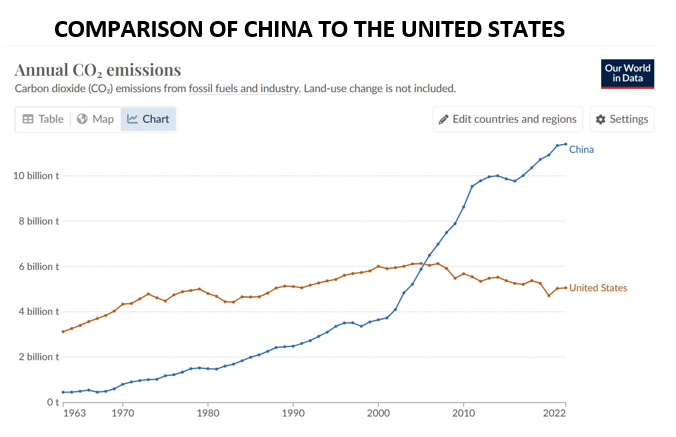
Let’s compare China’s Energy Consumption to the USA. Currently, the USA uses 25,000 Terawatt Hours of annual energy consumption, and it is declining. There has been no increase this century, since the year 2000. Note the bulk of the energy is provided (again) by coal, oil, and gas. Nuclear and “Renewable” make up approximately 20%. And the supply from “Renewables” is only 10% of the total. The remainder is from coal, oil, and gas.

The comparison over time between China and the United States reveals a great deal. Over the last 20 years, China’s total energy consumption has increased fourfold while America’s has remained static.

CO₂ EMISSIONS. This energy consumption pattern is reflected in CO₂ emissions. The chart for CO₂ emissions is almost identical to the previous one comparing energy consumption.
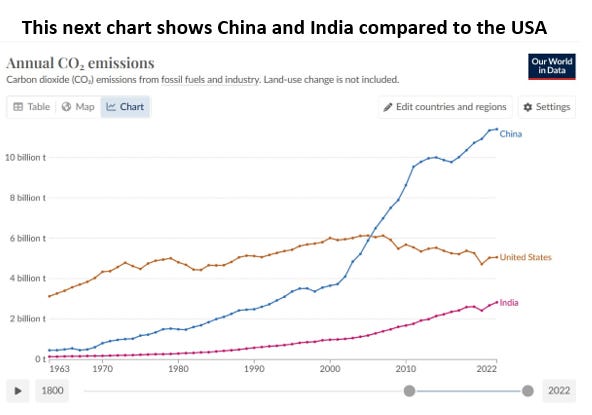
We can also compare China and the USA to Brazil, Germany, France, the UK, and India. India’s growth in CO₂ emissions has become increasingly obvious over the last 10 years. The populations of China and India are roughly the same, about 1.4 billion in each nation (give or take a few, billion). Thus, it is not unreasonable to expect India to grow its energy consumption and CO₂ emissions fourfold over the next 10 years.

THE PROGRESSION OF CO₂ EMISSIONS. We can also look at the progression of the share of Global CO₂ emissions over the last 220 years, since the beginning of the 19th century and the industrial revolution that began in the UK.
In 1800, the United Kingdom was responsible for about 98% of the world’s CO₂ emissions due to the coal-fired industrial revolution that started there first. Now, the UK is responsible for only 1% (or less) of global CO₂ emissions.
China now accounts for 30.8% while the US emits less than half that at only 13.5%. India is over half that already at 7.6% and rising and more than the 27 nations combined in the European Union. The world has changed and continues to do so, but it is the rise and rise of China and India that cannot be ignored. Together, they emit almost 38% of global CO₂ and they are on track to exceed 50% very soon.

CHINA TRADE IS BOOMING AGAIN. BOOM’s secret indicator for China's trade performance continues to rise. It began rising in early January after falling for almost two years due to the contrived Covid scamdemic. China is coming back.
The Chinese Shanghai Composite Stock Index has risen sharply since February as forecast by BOOM. BOOM is now expecting it to consolidate its 2024 gains and continue towards a longer run higher. We can watch its future progress throughout 2024. The people of China must be encouraged to invest in their corporate sector.

THE WESTERN ADVANCED NATIONS ARE DESTINED TO STRUGGLE ECONOMICALLY COMPARED TO THE BELT AND ROAD NATIONS. BOOM is of the firm opinion that China and the nations that join the Belt and Road Initiative will continue to enjoy consistent economic growth for the next ten years. The last ten years of growth since 2013 in shipping, energy production, and energy consumption are already revealing the advantages of the BRI.
Western-aligned nations that ignore this opportunity will suffer poorer economic growth and, possibly, long-term contraction compared to nations in the BRI. The “Net Zero” policies being adopted by the West will damage those national economies that pursue such unwise policies.
$275tn FOR NET ZERO, SO WHERE IS THE CAPITAL COMING FROM? In January 2022, McKinsey produced an analysis of the ‘NGFS ‘Net Zero 2050 scenario (Network of Central Banks and Supervisors for Greening the Financial System) titled “The Economic Transition: What would change in the net-zero transition”. It forecast that $275tn in cumulative spending on physical assets, or approximately $9.2tn per year, would be needed between 2021 and 2050 (to achieve “Net Zero”).
This ridiculous sum appears to be disconnected from financial reality as far as BOOM can see. It begs a very big question. Where is such risk capital to come from if there are insufficient returns or negative returns?
Over the last six months, BOOM has demonstrated the reluctance of private investors to stay invested in renewable energy, electric cars, and hydrogen energy projects. Private investors have already sold out of many “renewable” projects and associated technologies.
At this early stage, in 2024, it is becoming crystal clear that sufficient private risk capital is not going to be available to achieve “Net Zero”. The gamble is simply too great. It is a pipe dream, a fantasy that will harm the advanced Western economies dramatically in the long run.
BOOM’s QUANTITATIVE BOOSTING FOR THE PEOPLES MONEY EXPLAINED: https://boomfinanceandeconomics.wordpress.com/2019/12/15/boom-as-at-15th-december-2019/ AND BOOM’s Perfect Economy: https://boomfinanceandeconomics.wordpress.com/2020/01/18/boom-as-at-19th-january-2020/
COMING NEXT:
Letter from Great Britain – ‘VLAD the LAD’ - Saturday, April 06, 2024
BOOM Weekly Global Review – Tuesday, April 9, 2024
The Financial Jigsaw Part 2 – Off-Grid Finance – Saturday, April 13, 2024
In economics, things work until they don’t. Make your conclusions and do research. BOOM does not offer investment advice.
CLICK HERE FOR PODCASTS: OUR BRAVE NEW ECONOMIC WORLD
BANKS DON’T TAKE DEPOSITS, THEY BORROW YOUR MONEY: LOANS CREATE DEPOSITS — this is how almost all new money is created in the economy (by commercial banks making loans). https://www.bankofengland.co.uk/quarterly-bulletin/2014/q1/money-creation-in-the-modern-economy. Watch the short 15-minute video and see Professor Richard Werner brilliantly explaining how global banking systems work.
In 2014, Richard Werner provided the first empirical evidence that banks create credit out of thin air. They do this whenever they issue a loan or, more specifically, purchase a promissory note. This is a walk-through of exactly how they do it.
Many economists are unaware of this and even ignore the banking & finance sectors in their econometric models.
DISCLAIMER: All content is presented for educational and/or entertainment purposes only. Under no circumstances should it be mistaken for professional investment advice, nor is it at all intended to be taken as such. The commentary and other contents simply reflect the opinion of the authors alone on the current and future status of the markets and various economies. It is subject to error and change without notice. The presence of a link to a website does not indicate approval or endorsement of that website or any services, products, or opinions that may be offered by them.
Neither the information nor any opinion expressed constitutes a solicitation to buy or sell any neither securities or investments. Do NOT ever purchase any security or investment without doing your own and sufficient research. Neither BOOM Finance and Economics.com nor any of its principals or contributors are under any obligation to update or keep current the information contained herein. The principals and related parties may at times have positions in the securities or investments referred to and may make purchases or sales of these securities and investments while this site is live. The analysis contained is based on both technical and fundamental research.
Although the information contained is derived from sources that are believed to be reliable, they cannot be guaranteed.
Disclosure: We accept no advertising or compensation, and have no material connection to any products, brands, topics or companies mentioned anywhere on the site.
Fair Use Notice: This site contains copyrighted material the use of which has not always been specifically authorized by the copyright owner. We are making such material available in our efforts to advance understanding of issues of economic and social significance. We believe this constitutes a ‘fair use’ of any such copyrighted material as provided for in section 107 of the US Copyright Law. In accordance with Title 17 U.S.C. Section 107, the material on this site is distributed without profit. If you wish to use copyrighted material from this site for purposes of your own that go beyond ‘fair use’, you must obtain permission from the copyright owner.
Very helpful post!
Great analysis as ever but I get tired of seeing CO2 emissions as a proxy for bad. Recommend Climate The Movie for a great take-down