

FRESH NEW MONEY – A consistent supply of fresh new money is inextricably linked to the health of any economy …. and vice versa. A virtuous circle must be established for Prosperity to Flourish - [11-2
Direct from BOOM Finance and Economics

Hat Tip to my colleague at BOOM Fin4ance and Economics Substack (Subscribe for Free) - also on LinkedIn and WordPress. Covid Medical News Network CMN News BOOM Blog and All Editorials (over 5 years) at BOOM Finance and Economics | Designed for Critical Thinkers — UPDATED WEEKLY (WordPress.com)
BOOM Finance and Economics seeks out the very best information from authoritative sources and strives for consistency in its quality and trustworthiness. Over 5 years, BOOM has developed a loyal readership which includes many of the world’s most senior economists, central bankers, their senior advisers, fund managers, and academics. If you want a real edge in understanding the complex world of finance and economics, subscribe to BOOM on Substack or as a Follower on LinkedIn.
BOOM EDITORIAL THIS WEEK

FRESH NEW MONEY – WHERE DOES IT COME FROM ? A consistent supply of fresh new money is inextricably linked to the health of any economy.. A virtuous circle of good economic policies combined with good monetary policies must be established for nations to move towards prosperity.
The impact of fresh new money on any economy is like fresh new water for a garden. It is essential for health and growth. In normal economic circumstances, that fresh new money can only come from two sources:
growth in new commercial/retail bank loans and/or
increased circulation of physical cash. Persistent demand for both is critical.
Old bank loans are being continually paid off in any economy. That is a money-destructive process. So a healthy economy must (over time) replace old money with fresh new money. Old bank notes and coins also must be recalled and replaced. If bank loan demand falls relative to the size of the economy, then the supply of fresh new money falls and the economic garden is adversely affected. Increased cash in circulation can act as a buffer.
If both the volume of physical cash is falling and the volume of bank loan money (credit money) is falling, then the economy must eventually falter. The volume of physical cash produced is dependent upon consumer demand for it.
There is one (rare) exception to this money destruction and money creation dynamic and that is when a central bank embarks upon a program of QE (Quantitative Easing). In QE, fresh new money is created by ledger entries in the banking sector originated by the central bank. That money is used to purchase assets (usually Government issued Treasury securities) and the resultant funds wind up in the hands of the government. Those funds are then spent into the real economy as government expenditures.
QE programs have been used by central banks in many nations since the Global Financial Crisis 2008-09. This has arguably stabilised many economies and prevented a financial system collapse. However, the volume of fresh new money created by QE programs has been relatively small when compared to the total GDP since 2008. Therefore, BOOM will ignore QE programs in this analysis and concentrate on the more significant money supply generated by Private Credit as a Percentage of GDP.
The supply of fresh new physical cash and the supply of fresh new credit money (bank loans) are essential to keep the economic garden alive, healthy and growing. Last week, BOOM looked at the money supply dynamics of the following 10 nations – Hong Kong, United States, China, Japan, South Korea, Australia, Sweden, UK, France and Germany.
Hong Kong had supplied credit money to excess and became overheated with the economy eventually being negatively impacted. The UK and Germany had both reduced their credit money as a percentage of GDP for many years and both economies are now in dire straits with poorly performing economies.
NATIONS WITH STAGNANT OR FALLING FRESH NEW MONEY SUPPLY. This week BOOM looks at the money supply dynamics of the following 11 nations where Private Credit as a percentage of GDP is relatively flat or clearly falling: Indonesia, Estonia, Bulgaria, Lithuania, Egypt, Hungary, Ireland, Spain, Latvia, Portugal and Ukraine.
BOOM’s hypothesis is that a signal may be warning of potential economic fragility and persistent under-performance, if not recession.
However, it should be acknowledged that economic well-being cannot be viewed only through the single lens of GDP growth. BOOM is always ready to recognise that argument and has, in the past, discussed other ways of measuring economic well-being.
However, that knowledge does not preclude BOOM from looking at GDP growth prospects. For all its faults, the calculation of GDP does measure the totality of transactions occurring within an economy and that number can be relatively easily established. Expressing that number in US Dollars is also problematic and that is why PPP (Purchasing Power Parity) is arguably a far better measure.
BOOM is certainly a fan of PPP but its calculation can be horribly difficult to make given all the different circumstances within nations. Therefore, in this analysis, BOOM will use the yardstick of Annual GDP Growth as published by Trading Economics and sourced from each nation’s official statistical releases.
THE UNKNOWN VARIABLE – THE VOLUME OF CIRCULATING PHYSICAL CASH. The important thing to understand here is that there is another variable which may impinge upon the analysis. That variable is the volume of physical cash being used to settle transactions in the real economy of each nation. For example, it is understandable that nations such as Egypt and Indonesia may have huge circulations of physical cash. Cash volumes may differ significantly from nation to nation based upon social, historical and cultural differences. It is also very difficult to acquire information relating to physical cash volumes.
Thus, BOOM will have to make an analysis without knowing those cash volume characteristics. Readers need to take that into consideration.
NATIONS WHERE PRIVATE CREDIT AS A PERCENTAGE OF GDP IS FLAT TO FALLING. First, looking at a selection of nations where Private Credit as a percentage of GDP is relatively flat but, nonetheless, falling, is indicated by this graph which shows the World Median as a dotted grey line with data coming from the World Bank. The six nations represented here are Indonesia, Estonia, Bulgaria, Lithuania, Egypt and Hungary.

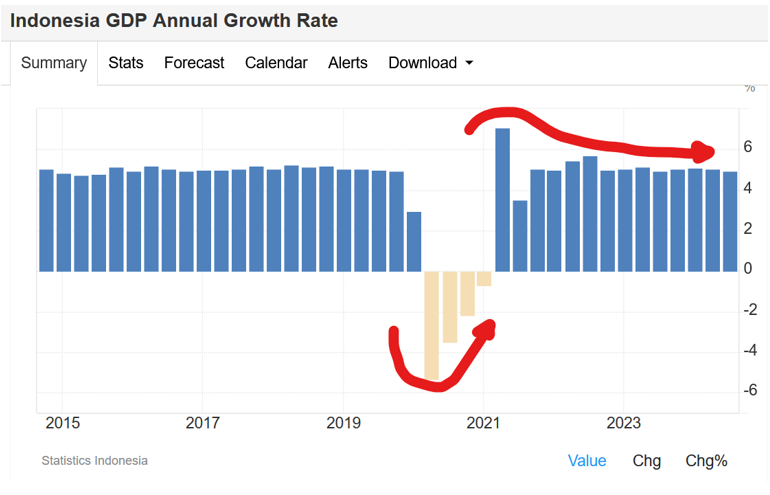
INDONESIA is the stand-out economy in this analysis. It had moderately rising levels of Private Credit as a Percentage of GDP until 2014. Since then, private credit has been flat to falling and, in 2022, it fell to around 35% of GDP. This is well below the Global Median of 44%.
However, it is difficult to make an accurate analysis of Indonesia or to make any possible economic forecast because it has a very large physical cash economy (which creates economic stability). The chart shows strong, steady Annual Growth in GDP in all time periods except in 2020. Annual Growth in Indonesia recovered strongly after that episode of Covid madness and has been strong ever since.
ESTONIA is serious concerning. It is very unlikely to have a large circulation of cash. Its Private Credit as a Percentage of GDP rose sharply to 100% into the Global Financial Crisis of 2007-08 (caused by US banking fraud). But, since then, it has fallen to below 60% in 2022. That fall is a major worry. With such a pattern, economic contraction is theoretically baked into the cake. And that is exactly what happened.
In the graph below, Estonia’s economy has contracted for more than two years since 2022. The graph shows consecutive nine quarters of negative annual GDP Growth running since Q2 2022.
The economic management of Estonia may be seriously amiss, or the nation has suffered a major hit to its trading position, or damage to its internal economic infrastructure. BOOM suspects poor money management as the culprit.

BULGARIA’S Private Credit as a Percentage of GDP also rose strongly upto the GFC in 2007-08. Since then it has declined. This is of some concern and would make Bulgaria a likely candidate for either a persistent economic contraction or a limited period of poor growth. The latter has happened. Bulgaria suffered a major recession in 2020 with four quarters of consecutive negative Annual GDP Growth. Since then, its growth has been positive but clearly is below the levels seen leading up to 2020.

LITHUANIA’S Private Credit as a Percentage of GDP has been falling ever since the 2007-08 Global Financial Crisis. It is now at 35% and well below the Global Median of 44%. That pattern suggests an economy that is struggling to grow. And the graph of Annual GDP Growth confirms this since 2021. Lithuania’s economy has under-performed compared to the years before 2020.

EGYPT’S Private Credit as a Percentage of GDP has been falling for over 20 years, since 2002. It was 30.85% in 2022, well below the Global Median level of 44%. This is a poor result and the nation is (theoretically) being starved of fresh new money supply. But there is again the unknown variable to consider here of physical cash. BOOM expects that Egypt has a very large cash volume in circulation.
However, the same familiar pattern emerges when the Annual GDP Growth a recession in 2020 in response to the Covid Panic-Demic, followed by a rebound but then the economy, as measured by Annual GDP Growth, seems to perform at below previous levels. However, overall, Egypt’s economy seems to have performed relatively well compared to the other nations in this week’s analysis.

HUNGARY’S Private Credit as a Percentage of GDP has the now familiar pattern. It rises to a peak from 2008-09 (59% as at 2008) but then it has fallen ever since until 2022, to 36%. Such a pattern should (eventually) be reflected in poor GDP Growth performance. Hungary’s economy suffered a deep recession in 2020 as did many economies. Then it recovered sharply but has not recovered solid Annual GDP Growth in the years since then with Annual GDP Growth being lower than previous years.

NATIONS WHERE PRIVATE CREDIT AS A PERCENTAGE OF GDP HAVE BEEN FALLING FOR LONG PERIODS. The second group of nations are those where Private Credit as a percentage of GDP is clearly falling but has been for many years. Without knowing the physical cash volumes in circulation, that pattern would raise serious suspicions of future economic instability.
The five nations selected to look at here are Ireland, Spain, Latvia, Ukraine and Portugal. Again, the graph shows the World Median as a dotted grey line and data comes from the World Bank.

IRELAND’S Private Credit as a Percentage of GDP rose strongly in the years prior to the Global Financial Crisis (GFC) in 2008. In 2009, the percentage had reached a peak of 170% but, since then, it has fallen dramatically and in 2022, it was 26%. This is a disastrous performance for the creation of fresh new money as bank loans. The money supply has been severely curtailed. According to BOOM’s hypothesis, this should result in poor economic performance and an economy prone to recession/contraction.
So, what happened? The graph for Annual GDP Growth tells the story. Somehow, Ireland managed to avoid a recession during 2020. However, in early 2023, the economy began to contract. Since then, every quarter has shown negative growth and Ireland seems to be stuck in a persistent recession that is now approaching two years in length.
This pattern concerns BOOM. It is hard to see how Ireland can recover from persistent poor economic growth. The Irish economy appears to have been very badly managed from a monetary standpoint. The chart reveals a veritable roller coaster with periods of sharp economic growth followed by periods of low growth until 2023 when a deep, persistent recession took hold.
Again, the theme of poor leadership must be addressed. In July, the Bank of Ireland forecast yet another year of recession: “The Irish economy could experience another technical recession this year, according to the Bank of Ireland.” [The Irish Times, July 3, 2024]

SPAIN’S Private Credit as a Percentage of GDP is a similar tale. It rose strongly in the years prior to the Global Financial Crisis (GFC) in 2008. In 2009, the percentage reached a peak of 174% but, since then, it has fallen dramatically and in 2022, it was 90%. The pattern is similar to Ireland’s but not as dramatic. However, there is some concern that the economic winds are heading in the wrong direction for Spain.
Spain suffered a very bad recession during 2020. But, since then, it rebounded strongly and continued to show good levels of economic growth. This is a good performance. However, if Private Credit as a Percentage of GDP continues to fall, then economic hardship is a given and worth watching.

PORTUGAL’S pattern of Private Credit as a Percentage of GDP is the same as Ireland and Spain. A peak in 2009 of 160% followed by a persistent fall to 2022, arriving at 90% of GDP. Again, Portugal suffered a severe contraction in 2020. Its GDP Growth has recovered and continued to be positive but at lower levels; again, worth watching.

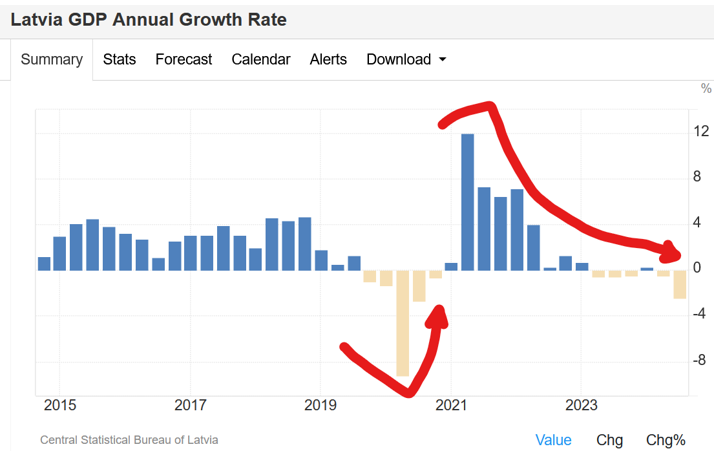
LATVIA, in one word, collapse. There is no other word to describe Latvia’s Private Credit as a Percentage of GDP over the last decade and more. In 2010, it registered 94.68%. Since then it has fallen off a cliff. In 2022, it registered at just 28.78%. This is now well below the Global Median of 44%. Latvia’s economy cannot escape the consequences of such a contraction in its money supply. The chart of Annual GDP Growth shows that the nation has entered a persistent state of recession since the second quarter of 2023. And that pattern now seems to be accelerating.
UKRAINE, finally, we have the devastated nation of Ukraine. Again, poor leadership prevailed for over a decade, beginning with the Maidan Square “revolution” of 2014 which has had very serious economic consequences from which it simply cannot emerge any time soon.

Ukraine’s Private Credit as a Percentage of GDP has fallen precipitously from 87% in 2009 to 23.5% in 2022. The invasion of Eastern Ukraine by the Russian SMO in February 2022 would have triggered further falls. However, updated statistics are not yet available in the World Bank database.
So, what happened to the nation’s GDP Growth? The chart can only tell part of the story. A serious recession in 2014 and 2015 followed the US/CIA created Maidan “revolution”. That was followed by a recession in 2020. Then a dramatic collapse in economic growth occurred in 2022 after the Russian “Special Military Operation” (SMO). The Statistics Service of Ukraine shows a recovery in economic growth in the second quarter of 2023 but BOOM is sceptical. The cash volume in Ukraine is the other variable which is hard to ascertain.

CONCUSION. Since the Global Financial Crisis in 2008, some nations have managed to survive adverse economic impacts from both the massive financial system crisis in 2008-09 and the Covid Epidemic of Panic in 2020. Others have not been so fortunate.
GOOD ECONOMIC OUTCOMES OCCURRED IN COMPLEX ECONOMIES ABLE TO RUN BUDGET DEFICITS AND QE PROGRAMS. IN ECONOMIES, WHERE CASH IS A PREFERRED METHOD OF PAYMENT, THEY PREVAILED.
In last week’s analysis, the nations that appeared to have weathered the storm relatively well included the USA, China, Japan, South Korea, Australia, Sweden and France. These are all complex, advanced economies which can moderate the economic swings and roundabouts by selling Government Securities and running budget deficits. QE programs are also a viable option.
In this week’s analysis, the nations that appear to have weathered the storm relatively well despite falls in Private Credit as a Percentage of GDP include Indonesia, Egypt, Spain and Portugal. Large Cash volumes in circulation may well be the critical factor.
Indonesia and Egypt almost certainly have high volumes of physical cash in circulation. This provides a buffer against too much (or too little) dependence on money created as credit. Cash is still the leading payment method in Spain. Spain is known for having a high share of cash payments when compared to other European countries. However, in Portugal cash payments are in decline and perhaps that may account for its relatively poor GDP Growth since 2020-21. BOOM is watching for a troublesome recession to occur there soon.
POOR ECONOMIC OUTCOMES OCCUR IF CREDIT MONEY AND CASH ARE PERSISTENTLY FALLING IN VOLUME. In last week’s editorial, the economies where the Private Credit creation as a percentage of GDP was over-heated or in decline suffered inevitable adverse economic consequences. They included Hong Kong, the United Kingdom and Germany.
This week, nations where Private Credit creation as a percentage of GDP has been in decline and where adverse economic consequences have resulted include Estonia, Bulgaria, Lithuania, Hungary, Ireland, Latvia, and Ukraine. There is no easy way forward for these nations. BOOM would suggest policies that encourage the increased use of physical cash and increased demand for bank loans. Those policies would create economic strength and growth.
A consistent supply of fresh new money is inextricably linked to the health of any economy and vice versa. A virtuous circle of good economic policies combined with good monetary policies must be established for nations to move towards prosperity.
COMING NEXT:
Letter from Great Britain – TOTALITARIAN CENSORSHIP – Saturday, November 30, 2024
BOOM Global Financial Review, Tuesday December 3, 2024
In economics, things work until they don’t. Make your conclusions and do research. BOOM does not offer investment advice.
CLICK HERE FOR PODCASTS: OUR BRAVE NEW ECONOMIC WORLD
BANKS DON’T TAKE DEPOSITS, THEY BORROW YOUR MONEY: LOANS CREATE DEPOSITS — this is how almost all new money is created in the economy (by commercial banks making loans). https://www.bankofengland.co.uk/quarterly-bulletin/2014/q1/money-creation-in-the-modern-economy. Watch the short 15-minute video and see Professor Richard Werner brilliantly explaining how global banking systems work.
In 2014, Richard Werner provided the first empirical evidence that banks create credit out of thin air. They do this whenever they issue a loan or, more specifically, purchase a promissory note. This is a walk-through of exactly how they do it.
Many economists are unaware of this and even ignore the banking & finance sectors in their econometric models. Prof Richard Werner explains how things are going now with CBDCs:
DISCLAIMER: All content is presented for educational and/or entertainment purposes only. Under no circumstances should it be mistaken for professional investment advice, nor is it at all intended to be taken as such. The commentary and other contents simply reflect the opinion of the authors alone on the current and future status of the markets and various economies. It is subject to error and change without notice. The presence of a link to a website does not indicate approval or endorsement of that website or any services, products, or opinions that may be offered by them.
Neither the information nor any opinion expressed constitutes a solicitation to buy or sell any neither securities or investments. Do NOT ever purchase any security or investment without doing your own and sufficient research. Neither BOOM Finance and Economics.com nor any of its principals or contributors are under any obligation to update or keep current the information contained herein. The principals and related parties may at times have positions in the securities or investments referred to and may make purchases or sales of these securities and investments while this site is live. The analysis contained is based on both technical and fundamental research.
Although the information contained is derived from sources that are believed to be reliable, they cannot be guaranteed.
Disclosure: We accept no advertising or compensation, and have no material connection to any products, brands, topics or companies mentioned anywhere on the site.
Fair Use Notice: This site contains copyrighted material the use of which has not always been specifically authorized by the copyright owner. We are making such material available in our efforts to advance understanding of issues of economic and social significance. We believe this constitutes a ‘fair use’ of any such copyrighted material as provided for in section 107 of the US Copyright Law. By Title 17 U.S.C. Section 107, the material on this site is distributed without profit. If you wish to use copyrighted material from this site for purposes of your own that go beyond ‘fair use’, you must obtain permission from the copyright owner.

In a monetarily sovereign nation like the U.S., fresh new money is easy to get by government spending. See https://mythfighter.com/.
Fascinating read. Makes logical sense. Yet seems the Government’s of today are ignorant to this. We need more money to grow like a plant needs water. Thnaks.